
Sequence diagrams are a great way to show the sequential relationships between items since they show the relationships in a systematic and straightforward way. This article discusses a sequence diagram, its components, and the guidelines for creating successful sequence diagrams. The purpose of this article is to maximize the design of software and user experiences.
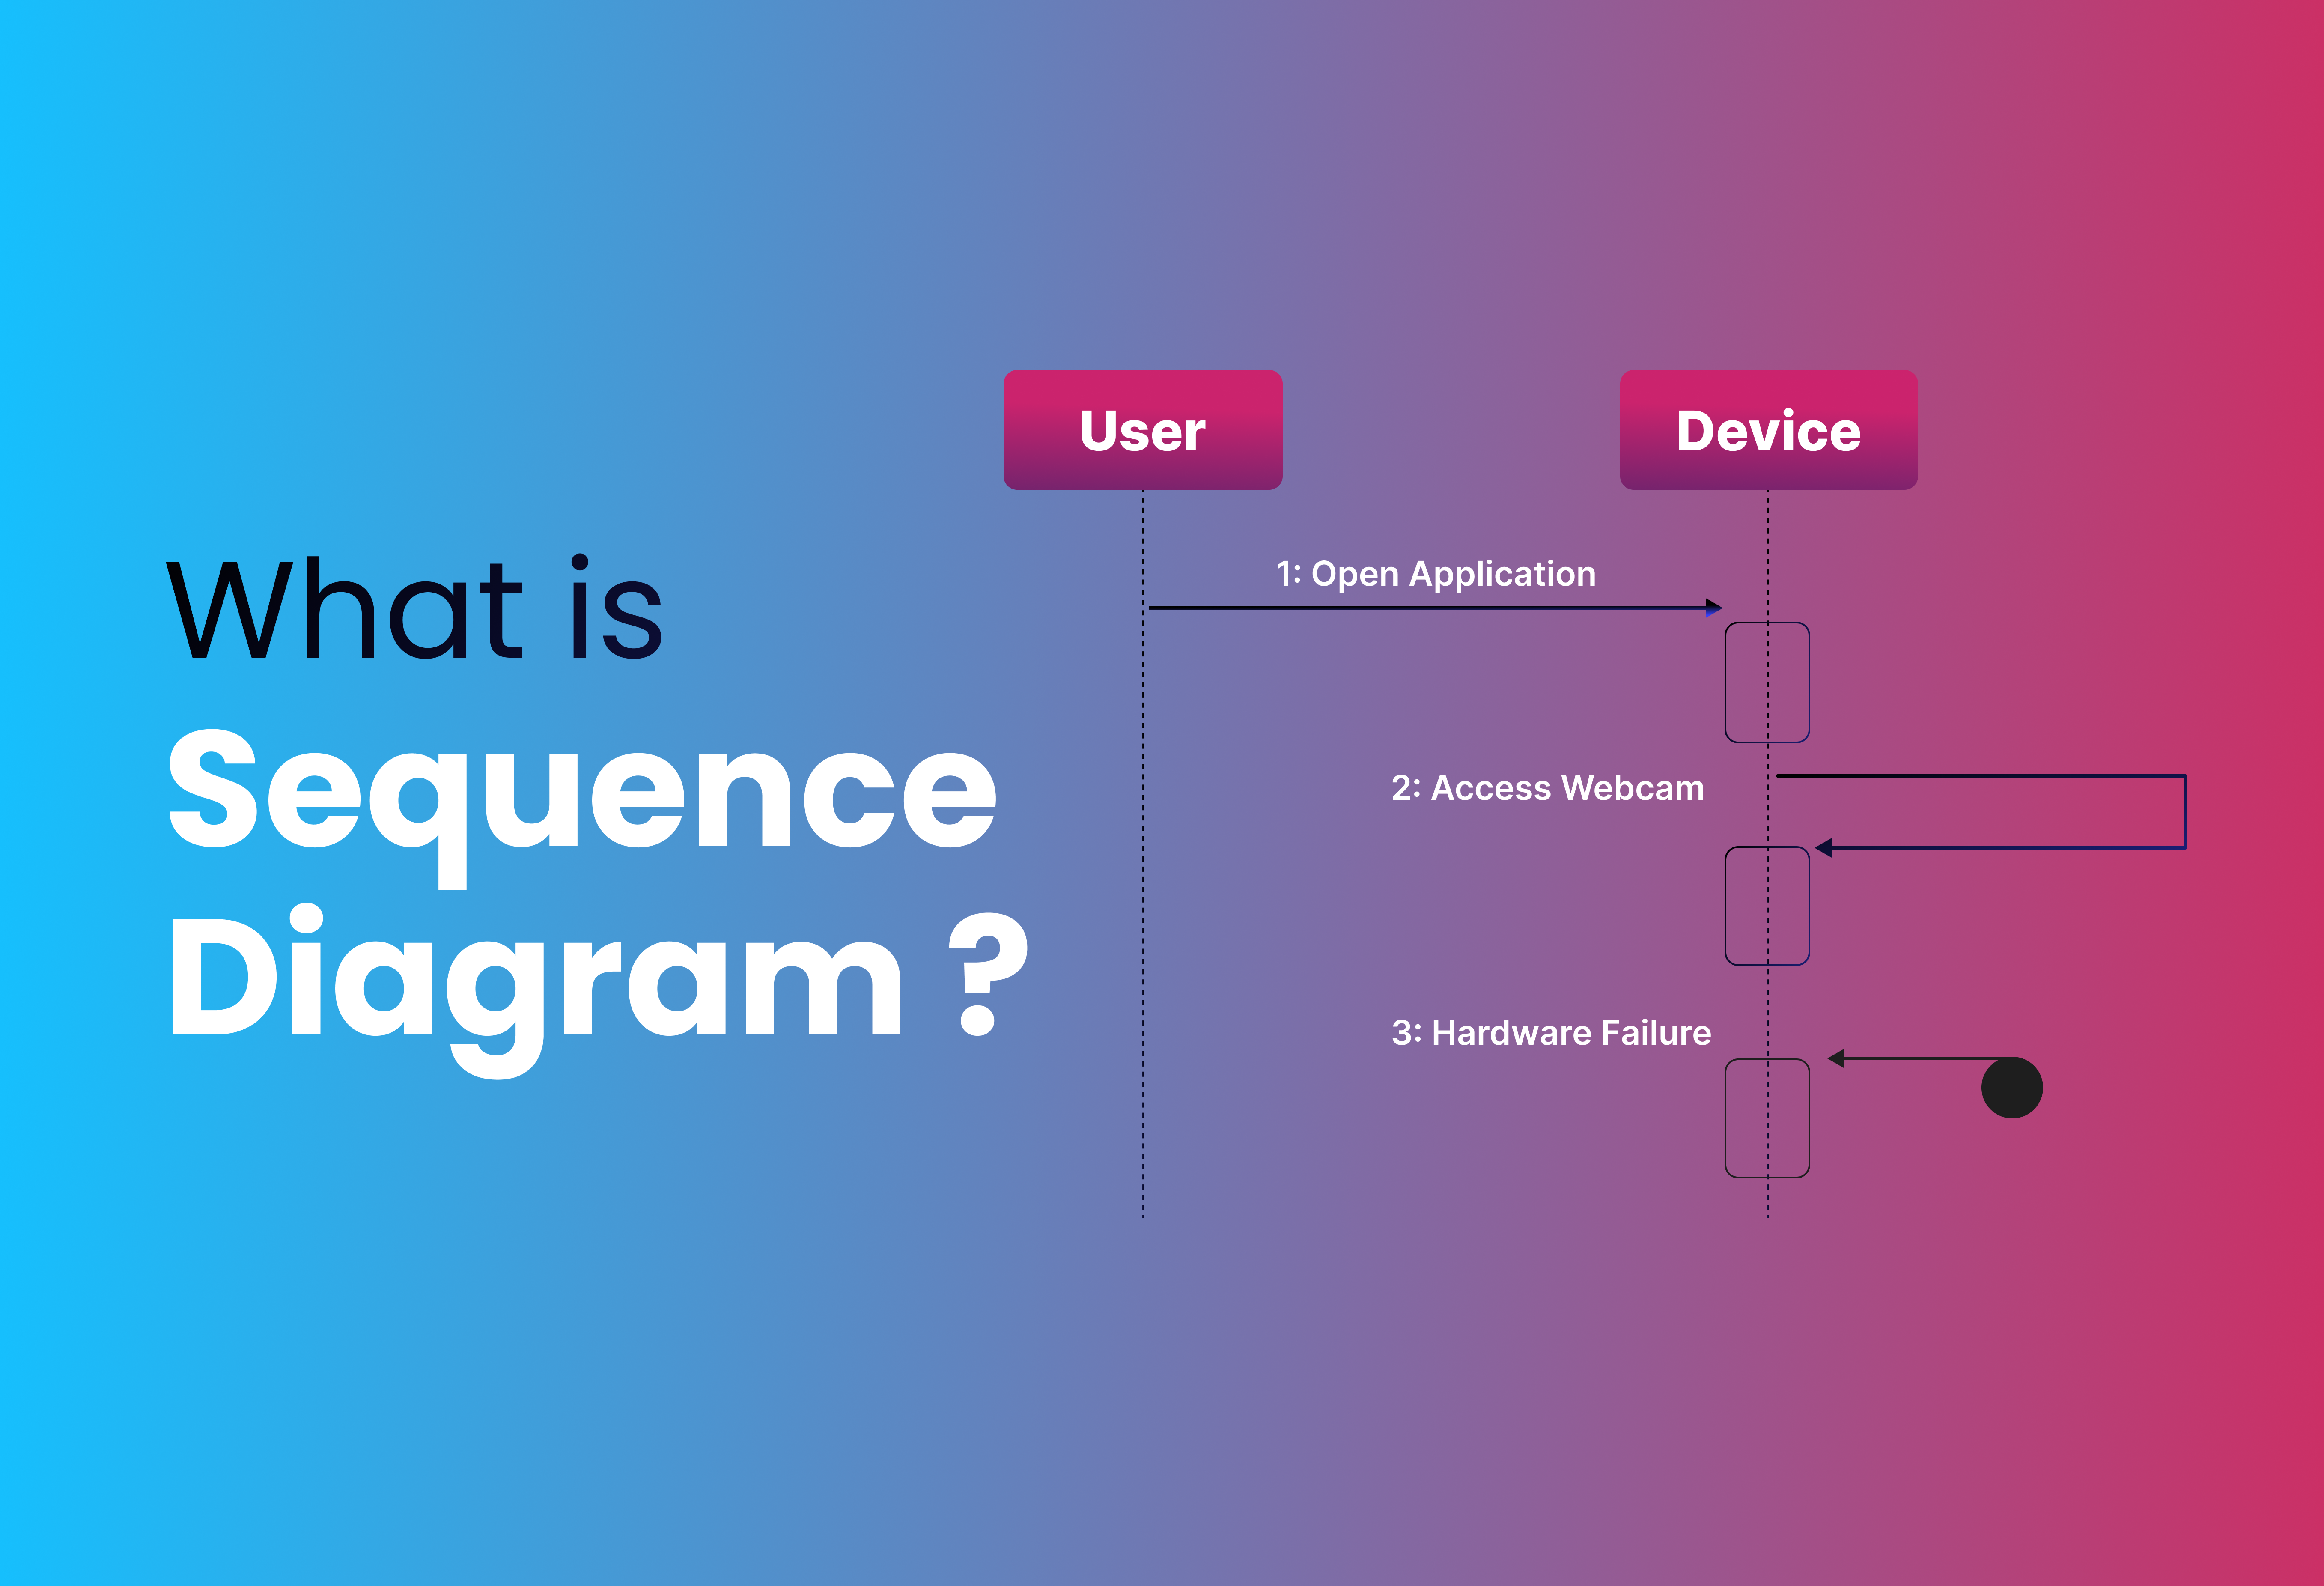
What is a sequence diagram?
When it comes to systems design, user experience, and software engineering, sequence diagrams are king. Sequence diagrams are a great way to show the sequential relationships between items since they show the relationships in a systematic and straightforward way. Unified Modeling Language (UML,) a standardized modeling language essential for comprehending and creating complex software systems, comprises these schematics.
What is unified modeling language?
A thorough understanding of UML is necessary to fully understand sequence diagrams. As a universal modeling language, software engineering makes use of UML. It provides a means of visualizing the architectural plans of a system, which include things like components, activities, actors, business processes, and database schemas.
There are many distinct kinds of diagrams, and they all work together to accomplish a common goal. The flow of information and interactions between your system’s components are the primary focus of interaction diagrams, of which sequence diagrams are a subset.

Other interaction diagrams
The most popular kind of interaction diagram is the sequence diagram. Nevertheless, communication diagrams and interaction overview diagrams are also useful.
By depicting the messages’ order and the circumstances in which they occur, sequence diagrams highlight the ways in which objects interact in a predetermined order. You can see the evolution of object-to-object communication throughout time in this timeline. To ensure consistency and clarity in your representations, it is necessary to understand UML. UML defines the standard rules and symbols used in sequence diagrams.
Types of sequence diagrams
For accurate system and scenario modeling, you should be well-versed in the many kinds of sequence diagrams.
1. Basic sequence diagram
Use this basic sequence diagram to show how simple items in a system interact with one another. It records the fundamental message flow and operation sequence.
2. Collaboration diagram
Collaboration diagrams, sometimes called communication diagrams, are very similar to sequence diagrams but are not exactly the same. Relationships and interactions between objects, rather than the time sequence, are their primary emphasis.
3. System sequence diagram (SSD)
The interactions between the system and external actors are the main emphasis of an SSD. It shines when applied to the study of user needs and the interplay between internal and external systems.
4. Detailed sequence diagram
This type furnishes additional details about the interactions, including:
- The precise method calls
- Return values
- Any additional conditions or limitations
5. High-level sequence diagram
These diagrams are helpful for strategic planning and analysis because they provide the big picture of how a system interacts. Despite their lack of detail compared to sequence diagrams, they effectively summarize the behavior of the system.
Whether you’re building a basic process or a complicated system, knowing how these sequence diagrams work can help you select the proper one.
Sequence diagram vs. activity diagram
It is essential to grasp the variations between the many kinds of diagrams you will meet as you go further into UML so that you can utilize them successfully. The distinction between activity diagrams and sequence diagrams is a common cause of misunderstanding.
| Sequence Diagram | Activity Diagram | |
| Focus | A sequence diagram highlights the temporal order of interactions. They depict the steps involved in the process by which entities communicate with each other through messages. | Activity diagrams, in contrast, show how processes move through a system. Workflow and control flow between activities are of more relevance to them. |
| Representation | We represent these diagrams vertically, with time progressing downwards. We depict objects as vertical lifelines and interactions as horizontal arrows. | Typically, these diagrams take the form of a flowchart, with arrows connecting the activities to illustrate the flow from one to the next. |
| Use case | It works well for understanding the flow of activities, modeling the exact behavior of a single use case, and identifying relationships and interconnections. | Rather than representing the intricate interplay between items, it excels at representing business processes, workflows, and the system’s general control flow. |
While activity diagrams and sequence diagrams are both useful UML tools, they aren’t interchangeable.
Ideal for comprehending interactions between certain objects, sequence diagrams are concerned with the sequential order of interactions. When it comes to modeling business processes and workflows, activity diagrams provide a more elevated perspective of the total process flow.
What is a sequence diagram editor?
Manually drawing sequence diagrams, particularly for more involved systems, may be a tedious and error-prone process. This is where sequence diagram editors come into play. By automating numerous process components, these technologies facilitate the production and administration of sequence diagrams.
A sequence diagram editor is a piece of software that facilitates the efficient creation, editing, and management of sequence diagrams. Among the many advantages of using a sequence diagram editor are the following:
Ease of use
A lack of in-depth technical understanding is not a barrier to using most sequence diagram editors because of their intuitive drag-and-drop interface.
Integration
To facilitate smooth handoffs between phases of development, these editors often connect with other platforms and technologies. To illustrate the point, there are editors that can sync up with code repositories and update diagrams if there’s a change to the code.
Libraries and templates
You may simplify the process and ensure uniformity across your diagrams using the range of templates and libraries of standard components offered by several sequence diagram editors.
Automation
A common automation feature of these tools is the ability to create diagrams automatically from code or other inputs. Doing so may guarantee precision while saving a considerable amount of time.

Collaboration
Multiple team members may now work on the same sequence diagram at the same time, thanks to the collaboration capabilities offered by many current sequence diagram editors. This is especially helpful for big projects with many different people involved.
Consistency
To keep your diagrams consistent and in line with UML standards and norms, you may use a sequence diagram editor. For effective recordkeeping and communication, this is vital.
A few examples of popular sequence diagram editors include Lucidchart, Microsoft Visio, and online platforms like Draw.io and Creately. It is crucial to choose a tool that complements your workflow and demands since they differ in features and capabilities.
If you want your sequence diagrams to be precise, consistent, and professionally done, using an editor might help you out a lot. These tools provide the capability you need to generate successful diagrams, no matter the size of your project or system.
Sequence diagram elements
You must be familiar with the fundamentals of sequence diagrams in order to draw them effectively. All of the parts work together to show how things interact with one another and how events unfold. In order to help you use sequence diagrams more efficiently, we will now dissect their basic elements.
1. Lifelines
Each lifeline stands for each interaction participant. Objects, actors, or systems may all take part. When drawing a lifeline, we use a rectangle and a dashed line to represent its descent. A dashed line, or lifeline, indicates the object’s presence throughout time, while the rectangle includes the object’s name or actor.
Because they ground interactions and messages, lifelines are crucial. They facilitate the identification of the interaction’s participants and the tracking of their duration.
2. Actors
The system interacts with actors, who are entities from the outside. Sequence diagrams usually use either a labeled rectangle or a stick figure to depict the performers. Sending and receiving messages is how actors start interacting with the system. If you want to know what goes in and out of your system, identify the players.
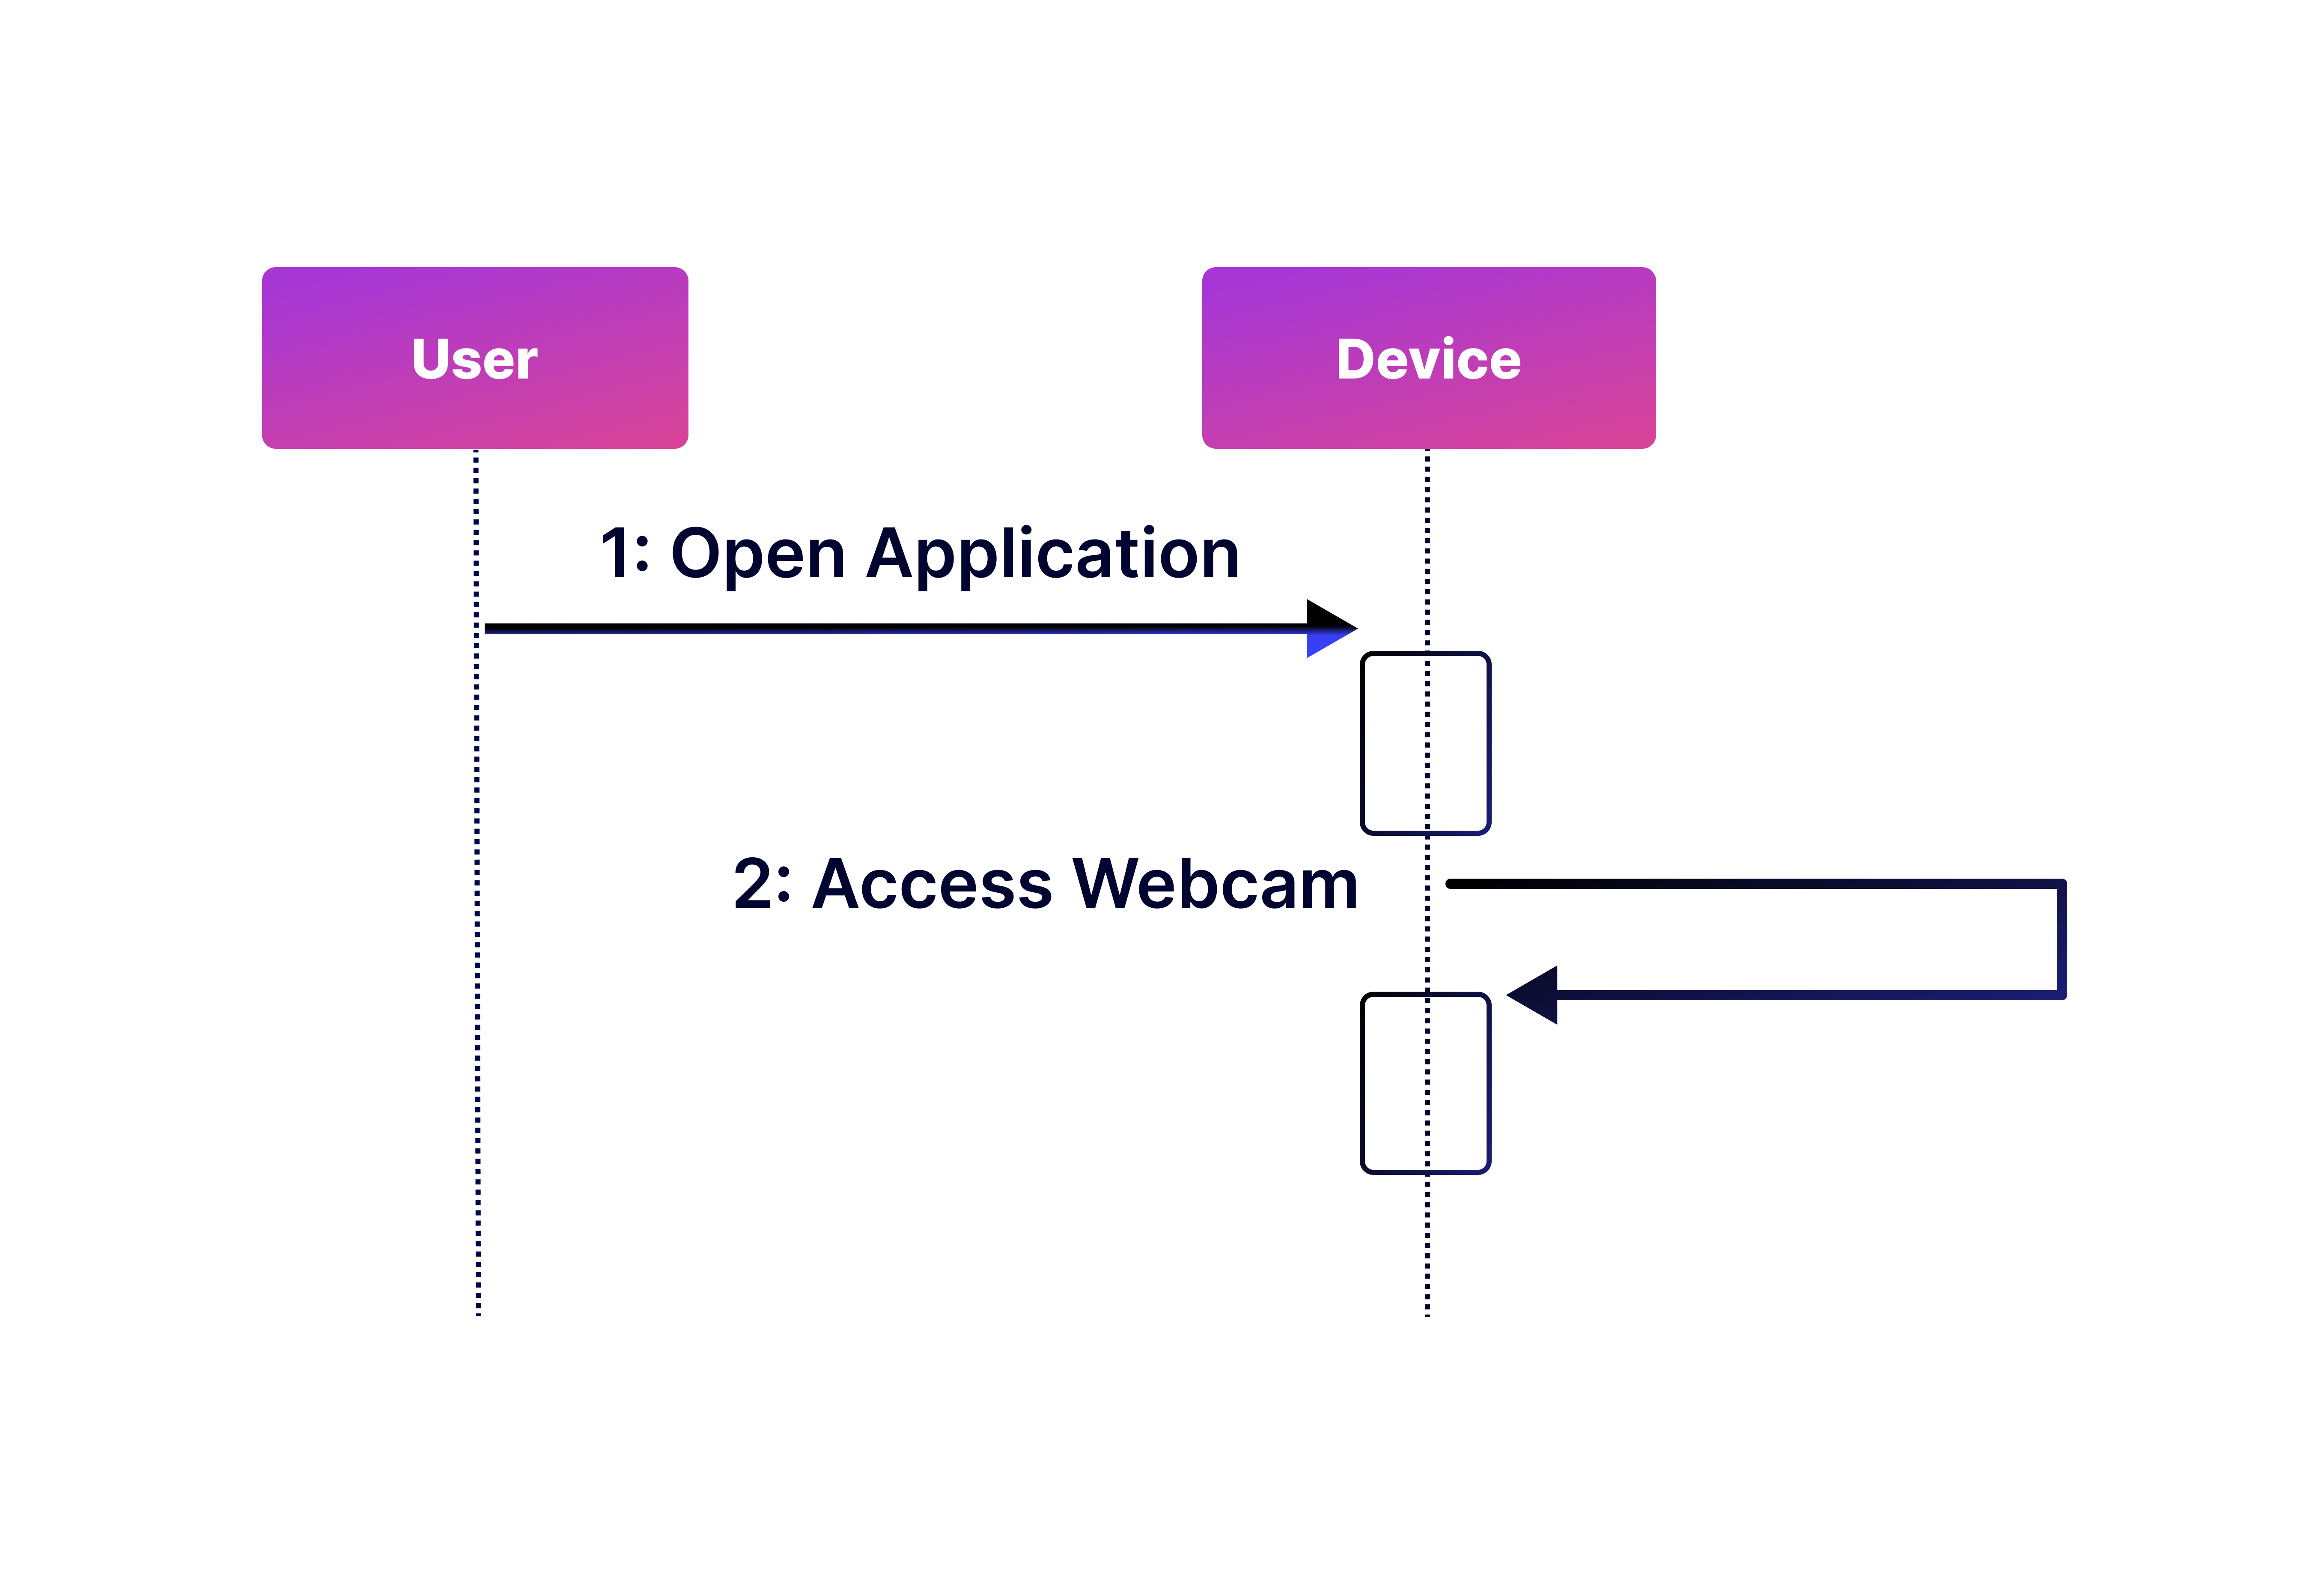
3. Messages
Lifelines are able to communicate with one another via messages. We show them as arrows that go from one party to another. Various sorts of messages are possible:
Synchronous messages
A full arrowhead on a solid line represents these occurrences. While the receiver processes the message and returns control, the sender waits.
Asynchronous messages
Asynchronous messages, symbolized by a solid line with an open arrowhead, do not need the sender to patiently await the recipient to comprehend the message.
Return messages
To restore control to the sender, look for a dashed line with an open arrowhead.
Self-messages
These happen whenever an item communicates with itself; the arrow that returns to the original lifeline represents this.
Accurately depicting interactions and their interdependence requires knowledge of the various message kinds.
4. Activation bars
The focus of control or activation bars indicates the duration of an operation. Over a lifeline, they form vertical rectangles. The activation bar’s length indicates how long the procedure took. You may better understand the interdependencies and overlaps in your event sequence with the use of activation bars. This shows how much time an item spends on each process.
5. Gates
In a sequence diagram, “gates” are interaction points that allow data to flow between them or between the sequence diagram and other diagrams. Gates make complicated diagrams easier to understand by dividing the interactions into smaller, more understandable components. They show where the interaction continues in another area or diagram and are often little circles on the border of the illustration.
6. Fragments
Depicting intricate control structures like loops, alternatives, and parallel execution, fragments enclose a piece of a sequence diagram. Different kinds of fragments include:
Alt or alternative
Shows conditional branching. A guard condition controls the execution of each portion of the fragment.
Opt or optional
Depending on the fulfillment of a certain condition, it exhibits optional interactions.
Loop
Shows that there are repeated exchanges. The number of iterations of the interactions is defined by a condition in the loop segment.
Par or parallel
Represents parallel execution of interactions.
If you want to keep complexity under control, use fragments to define the various control flows in your interactions.
Visit our blog for more informative articles
Guidelines for the creation of sequence diagrams
Following certain guidelines and standards is essential while making sequence diagrams. Following these guidelines will make your diagrams more legible, precise, and consistent.
Identify all participants
Before developing your sequence diagram, make a list of all the players in the interaction. This covers both objects and actors. Clearly identifying all participants ensures that you record all required interactions and avoid leaving out key aspects.
Define the scope
Find out how far the sequence diagram can go. For this paradigm, what is the intended interaction or process? You may eliminate superfluous complexity and zero in on key interactions by defining the scope.
Arrange lifelines clearly
Sort lifelines from left to right according to the sequence in which they contribute to the interaction. Because of this, the diagram is simpler to understand, and the reasoning continues to flow. To indicate their presence across time, make sure the lifelines continue vertically throughout the design.
Utilize appropriate message arrows
To depict various kinds of messages, use the right arrows. Arrowheads should be filled in, and lines should be solid for synchronous messages. Arrowheads should be open for asynchronous messages and dashed lines for return messages.
Keep messages concise and clear
Clearly and succinctly label messages. Instead of describing things in detail, use action verbs. Anyone perusing the illustration may swiftly grasp the interactions thanks to the descriptive labels.
Utilize activation bars
You can see when an item is doing anything by looking at its activation bar. This makes the timeline more understandable by illustrating the length of time tasks take and how often they overlap.
Leverage fragments for intricate logic
Use fragments such as alt, opt, loop, and par when dealing with complicated control flows. These elements allow you to efficiently manage complexity by encapsulating various control mechanisms.
Maintain consistency
Verify that your diagram meets UML standards. Being consistent with notation and arrangement will make your diagrams look better and easier to understand.
Evaluate and edit
Make sure your sequence diagram is accurate and comprehensive by reviewing it once you’ve drawn it. Be sure to look for any discrepancies or missing interactions. If the diagram isn’t clear or accurate, make the necessary revisions.
Why are sequence diagrams important, and what advantages do they provide?
Software developers and system designers rely heavily on sequence diagrams. That’s why you can’t do your tasks without them.
1. Facilitating the development of test cases
Using sequence diagrams to generate test cases is a practical advantage. A sequence diagram is a useful tool for developing test cases as it shows the typical flow of events. This will lead to better software quality and more efficient testing since your test cases will be thorough and in line with the intended interactions.
2. Encouragement of agile development
A dynamic and adaptable method of modeling system interactions, sequence diagrams are essential in agile development’s iterative design and constant feedback.
Maintaining up-to-date documentation and models is essential throughout the development lifecycle. You can simply update them to reflect changes in requirements or design. The flexibility of sequence diagrams makes them perfect for agile teams that aim for quick and responsive development.
3. Clear visualization of interactions
Among sequence diagrams’ many uses is the clear and succinct depiction of the temporal relationships between various objects. Because it shows the precise order of events and the interdependencies among various components, the temporal element is vital.
By depicting the interactions in a chronological order, sequence diagrams make it easier to comprehend the flow of messages, spot any bottlenecks, and quantify every encounter.
4. Improved communication
The success of any development project hinges on the team’s ability to communicate effectively with one another. Because they graphically depict the behavior of the system, sequence diagrams are a great tool for communication.
Clients, stakeholders, and team members without a strong technical experience can understand their complicated interactions because of this. One way to improve communication and cooperation across teams is to simplify complicated operation sequences into simple diagrams.
5. Documentation enhancements
It is crucial for software projects to have thorough and accurate documentation. In order to capture the ever-changing nature of a system, sequence diagrams are important. As a visual addition to your documentation, they depict the interaction flow in a way that words alone can’t always achieve.
As an alternative to reading through long written explanations, new team members may quickly get up to speed by examining the sequence diagrams, which can be very helpful during onboarding.
6. Recognizing design problems in early stages
If you want to find design problems early on, sequence diagrams are your best bet. A useful way to find inconsistencies, missing interactions, and possible performance problems is to model the interactions between objects and systems. By resolving problems during the design process instead of during implementation or software testing, this proactive strategy may help you save a lot of time and money.
Examples of sequence diagrams
For a better understanding of sequence diagrams’ real-world uses, let’s look at a few instances. These examples will show you how to use sequence diagrams to describe interactions in various contexts.
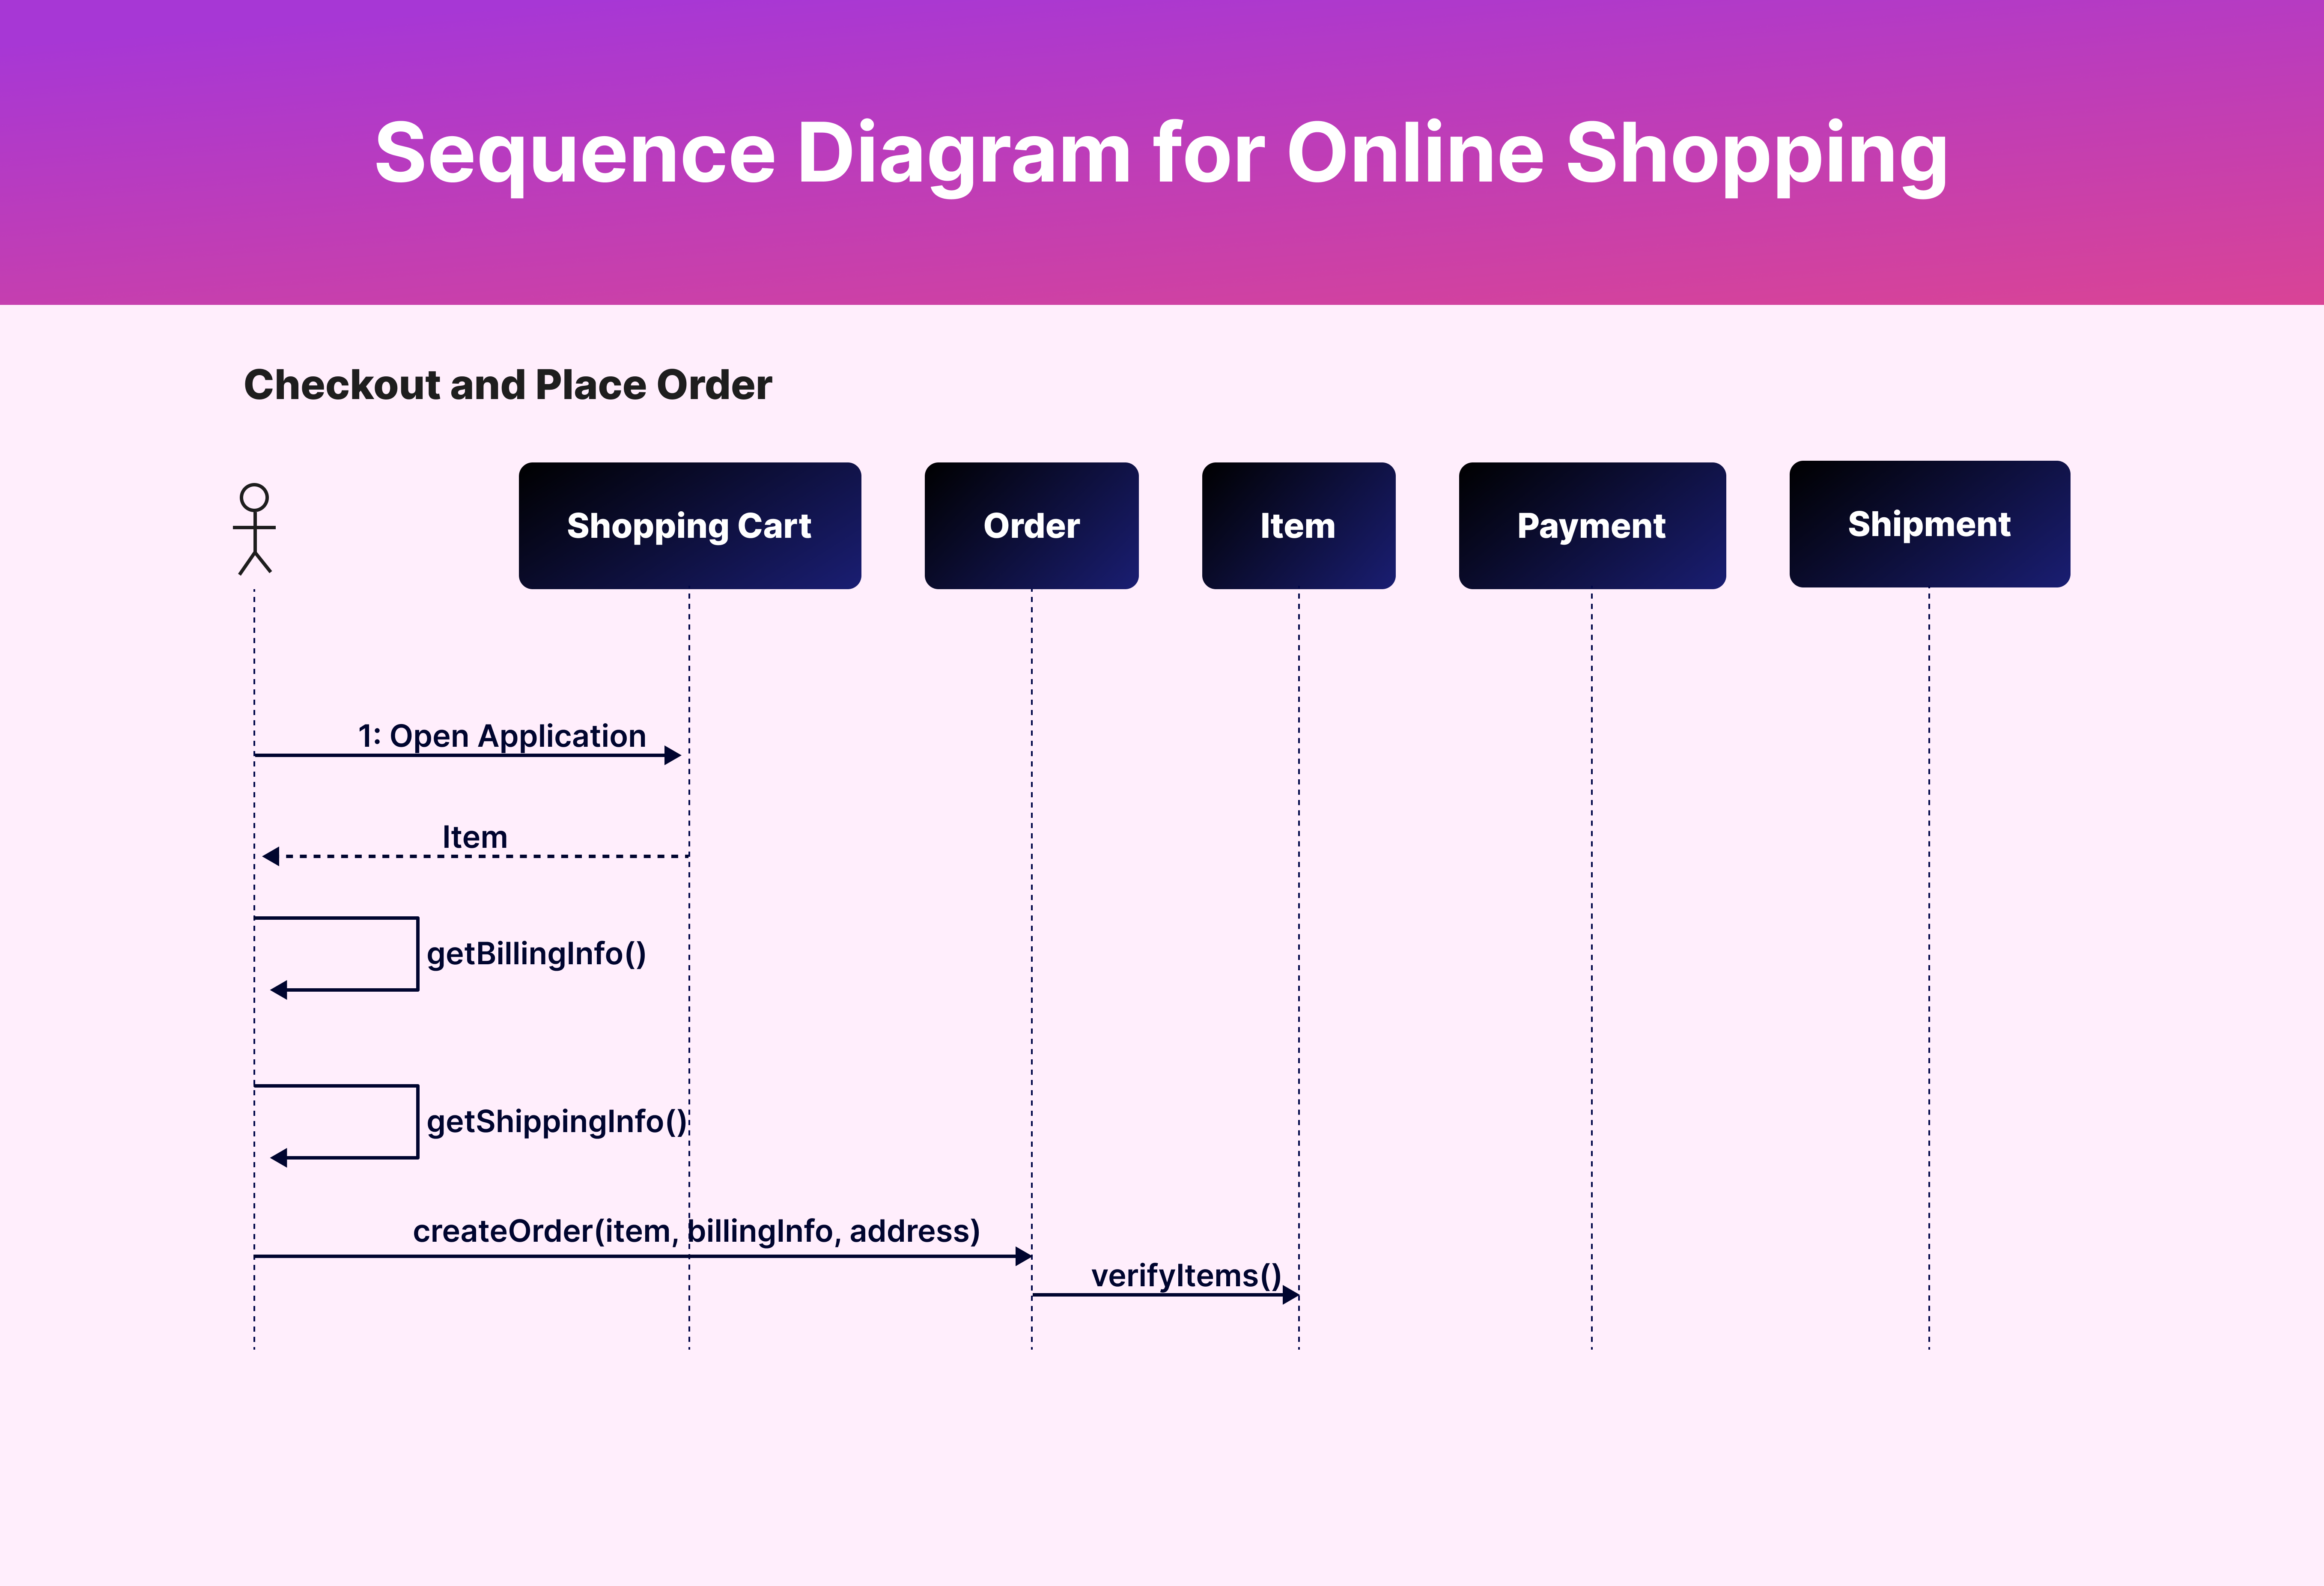
Example 1: Online Shopping Checkout
During the online shopping checkout process, the consumer interacts with the shopping cart system, the payment gateway, and the order processing system many times.
Customer: Adds things to cart and checks out.
Shopping cart system: Sends a shopping cart summary to the buyer for review.
Customer: The customer verifies the order and makes the payment.
Payment gateway: Payment gateways process payments and deliver confirmations to shopping cart systems.
Shopping cart system: The shopping cart system confirms orders and delivers data to the processing system.
Order processing system: The order processing system prepares orders for shipping and delivers confirmations to customers.
Here we can see the checkout process and how different systems interact with consumers in a more detailed sequence diagram.
Example 2: User Login Process
A sequence diagram is useful for understanding how the authentication system, the login interface, and the user all work together throughout the login process.
User: The user commences the procedure by inputting credentials and clicking the login button.
Login interface: The login interface delivers user credentials to the authentication system.
Authentication system: The authentication system verifies credentials. If the request is legitimate, it returns a success message to the login interface; otherwise, it returns a failure message.
Login interface: The login interface provides a message to users depending on authentication system responses.
This basic sequence diagram makes it easier to view the interaction between various components and the flow of messages throughout the login process.
Wrapping up
One of sequence diagrams’ strongest points is the clarity and precision with which it depicts interactions. Since its inception with UML, sequence diagrams have remained popular owing to their enduring clarity.
Due to their considerable flexibility, modern development approaches like Agile, DevOps, and CI/CD pipelines may combine sequence diagrams. The use of AI and automation in software development is on the rise, and these tools are essential for developing and improving automated processes.
Project success and top-notch software are within reach when you use sequence diagrams to enhance system design, analysis, and communication.