

In this post, let’s discuss preventing and detecting memory leaks in Android apps. The task of keeping an app operational when a user launches it on a mobile device falls on the application’s allocated resources. Nevertheless, these electronics have a limited amount of memory. The inability to allocate memory will cause the app to fail repeatedly as memory use and needs increase.
Garbage collectors make sure that devices use memory efficiently. At runtime, a garbage collector helps free up memory by removing objects that are no longer used by the application in question. This prevents the device from crashing by restoring the memory.
The failure of garbage collectors
The garbage collector may not always be successful in freeing objects and reclaiming their memory. Inefficient memory consumption occurs when the object keeps using memory even after the application no longer needs it. We call this kind of situation a memory leak.
The presence of a reference to an object that should be garbage collected causes a memory leak. Despite the creation of new instances of that object, the application will keep earlier ones in memory. They will ultimately use up all of the application’s memory if they remain in memory for an extended period of time. The application will eventually fail after alerting the user about its low memory performance.
It is our responsibility as developers to ensure that our apps do not encounter this issue and make optimal use of memory. The purpose of this tutorial is to teach you how to use Android Studio to find memory leaks in your applications and how to fix them.
Preventing and Detecting Memory Leaks in Android Apps
It is essential for every Android developer to understand the inner workings of Android memory management and how it is structured and managed. Finding memory leaks and fixing them is part of this.
Let’s talk about the two main ways that Android finds memory leaks. Here, we’ll create a sample app that purposefully leaks memory. And then, we’ll show you how to find and report this kind of leak.
Creating a sample Android app
Make a new Android project in Android Studio, and then proceed with the steps given below.
It all starts with establishing a singleton class. One design pattern that limits an application to instantiating a single instance of a class at runtime is the singleton class. In this case, there is only one instance of the object in your whole codebase. It is not possible to create more than one of them. Because it has a static reference to itself, you may access it from any part of your code.
We will use Java to show the various leak situations. This case, however, is equally relevant to Kotlin apps.
Starting with a new class named SingletonClass, it will produce a singleton. Afterwards, refer to the SingletonClass class using a static reference:
public class SingletonClass {
private static SingletonClass singletonClassInstance;
private Context context;
private SingletonClass(Context context){
this.context = context;
}
public static void singletonClassInstance(Context context){
if (singletonClassInstance == null){
singletonClassInstance = new SingletonClass(context);
}
}
}
To execute the class, initialize its context inside the MainActivity’s onCreate method:
SingletonClass.singletonClassInstance(this)
Using Android Profiler for detecting memory leaks
One feature of Android Studio is the Android Profiler, which lets you see how your Android app is doing in real time.
In this tutorial, we will learn how to utilize Android Studio’s memory profiler to examine memory and understand how it works.
If you want to use Android Profiler, you’ll need Android Studio v.3.0 or later installed on your PC.
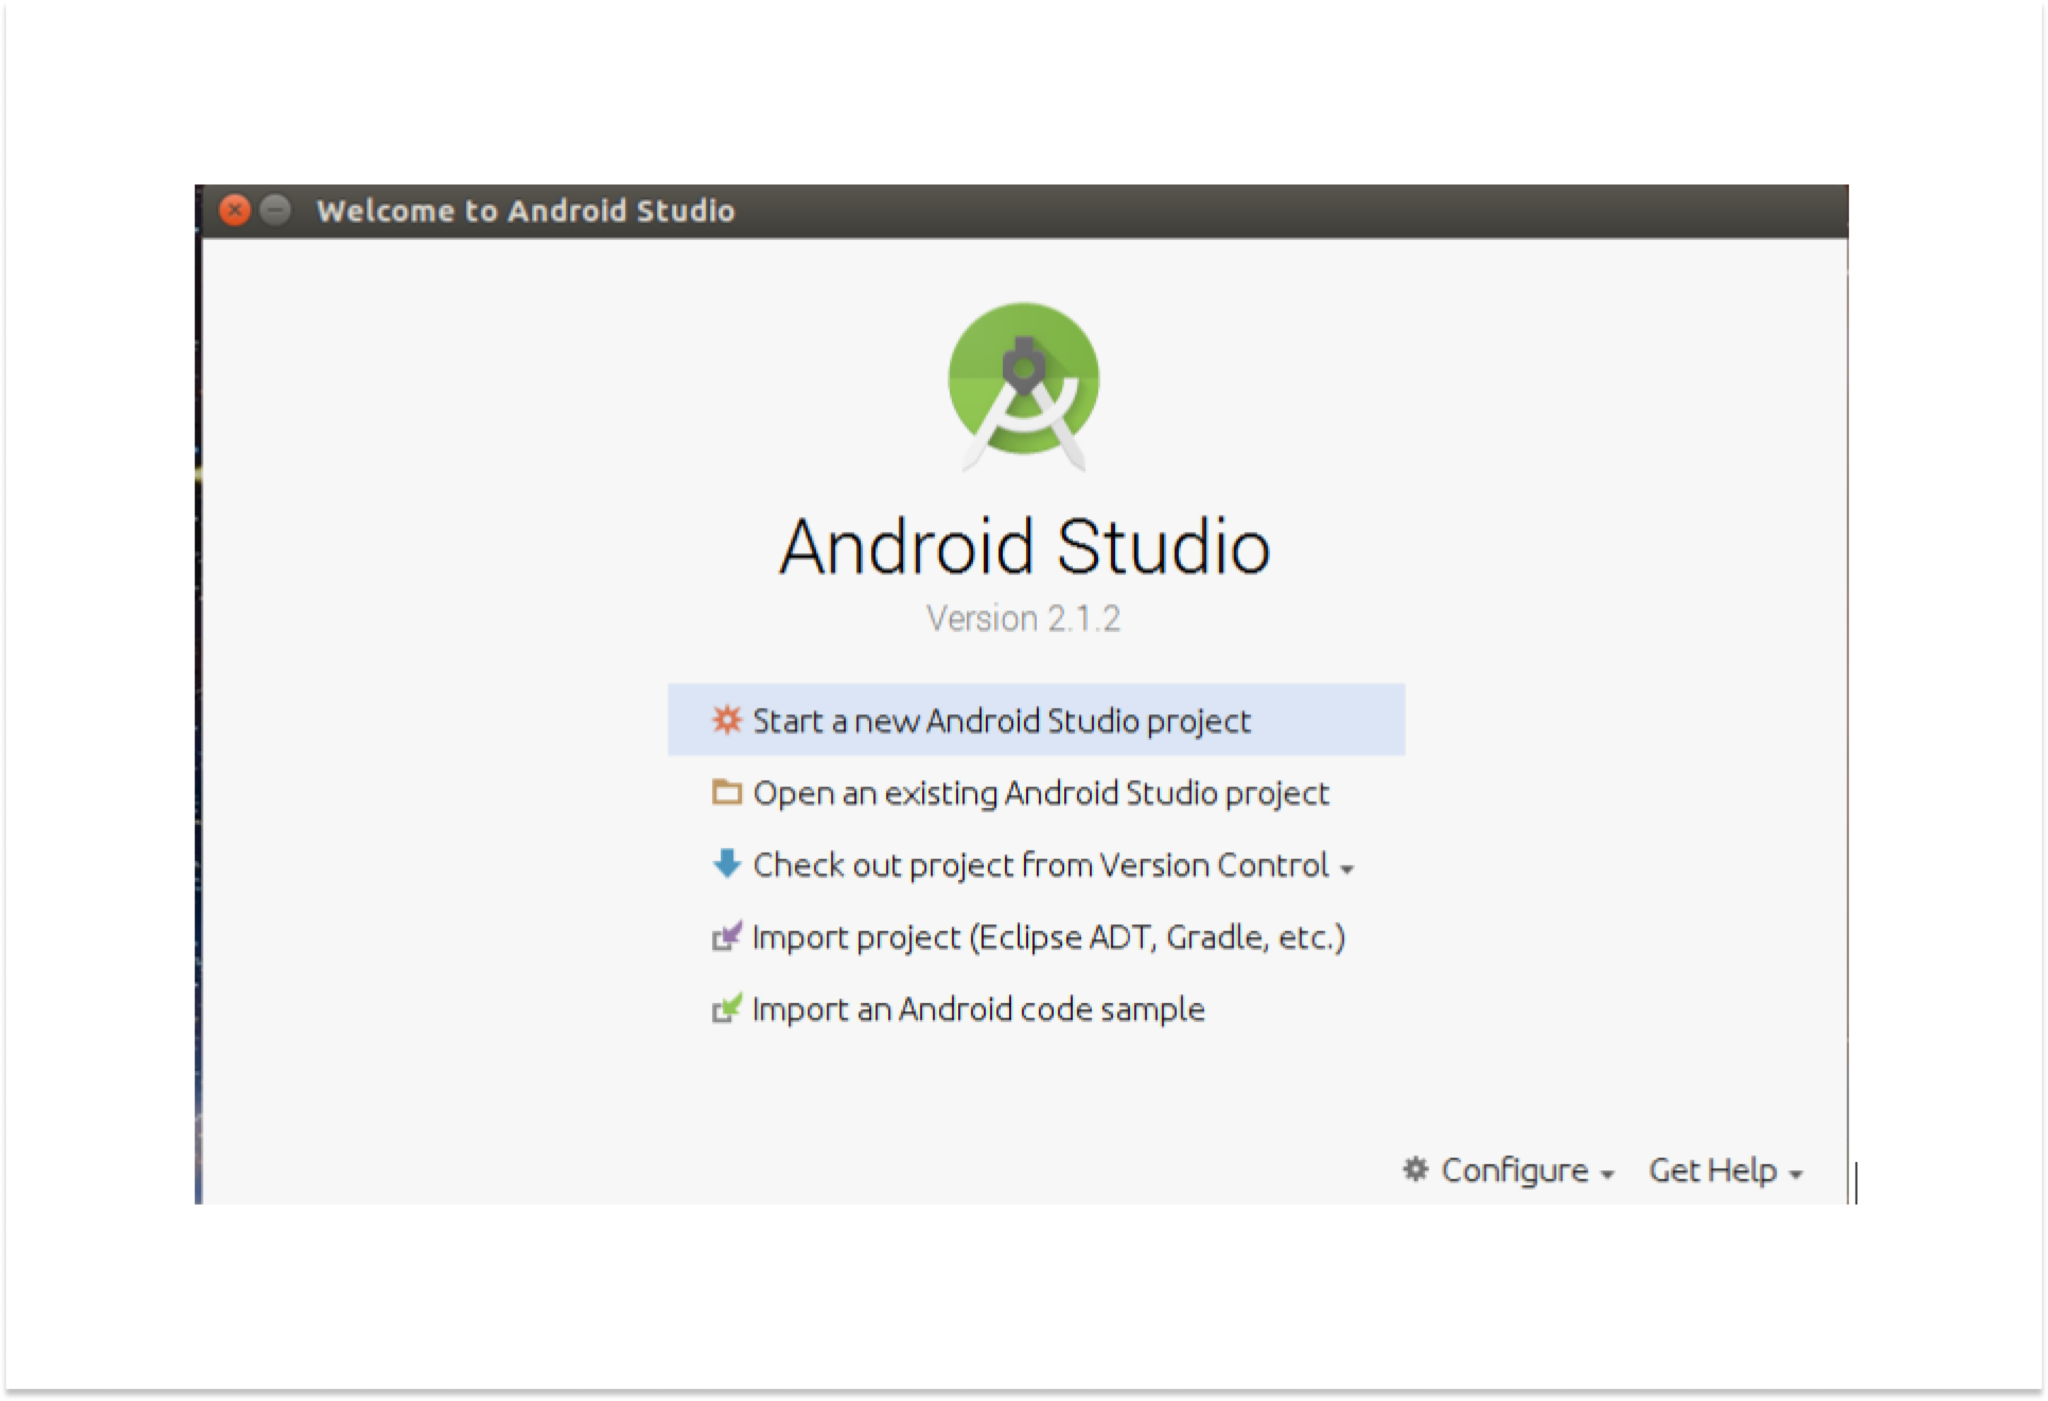
Get Android Studio up and running, and then open the Android Profiler.
Press the plus sign to create a new session once Android has started your profile. It is essential that you choose both the device and the application bundle that you have developed.
A new profile to track your app’s performance in real time will open when the season is established. How the session keeps track of memory use is of interest to us.
Tap any point on the blue row to access the memory.
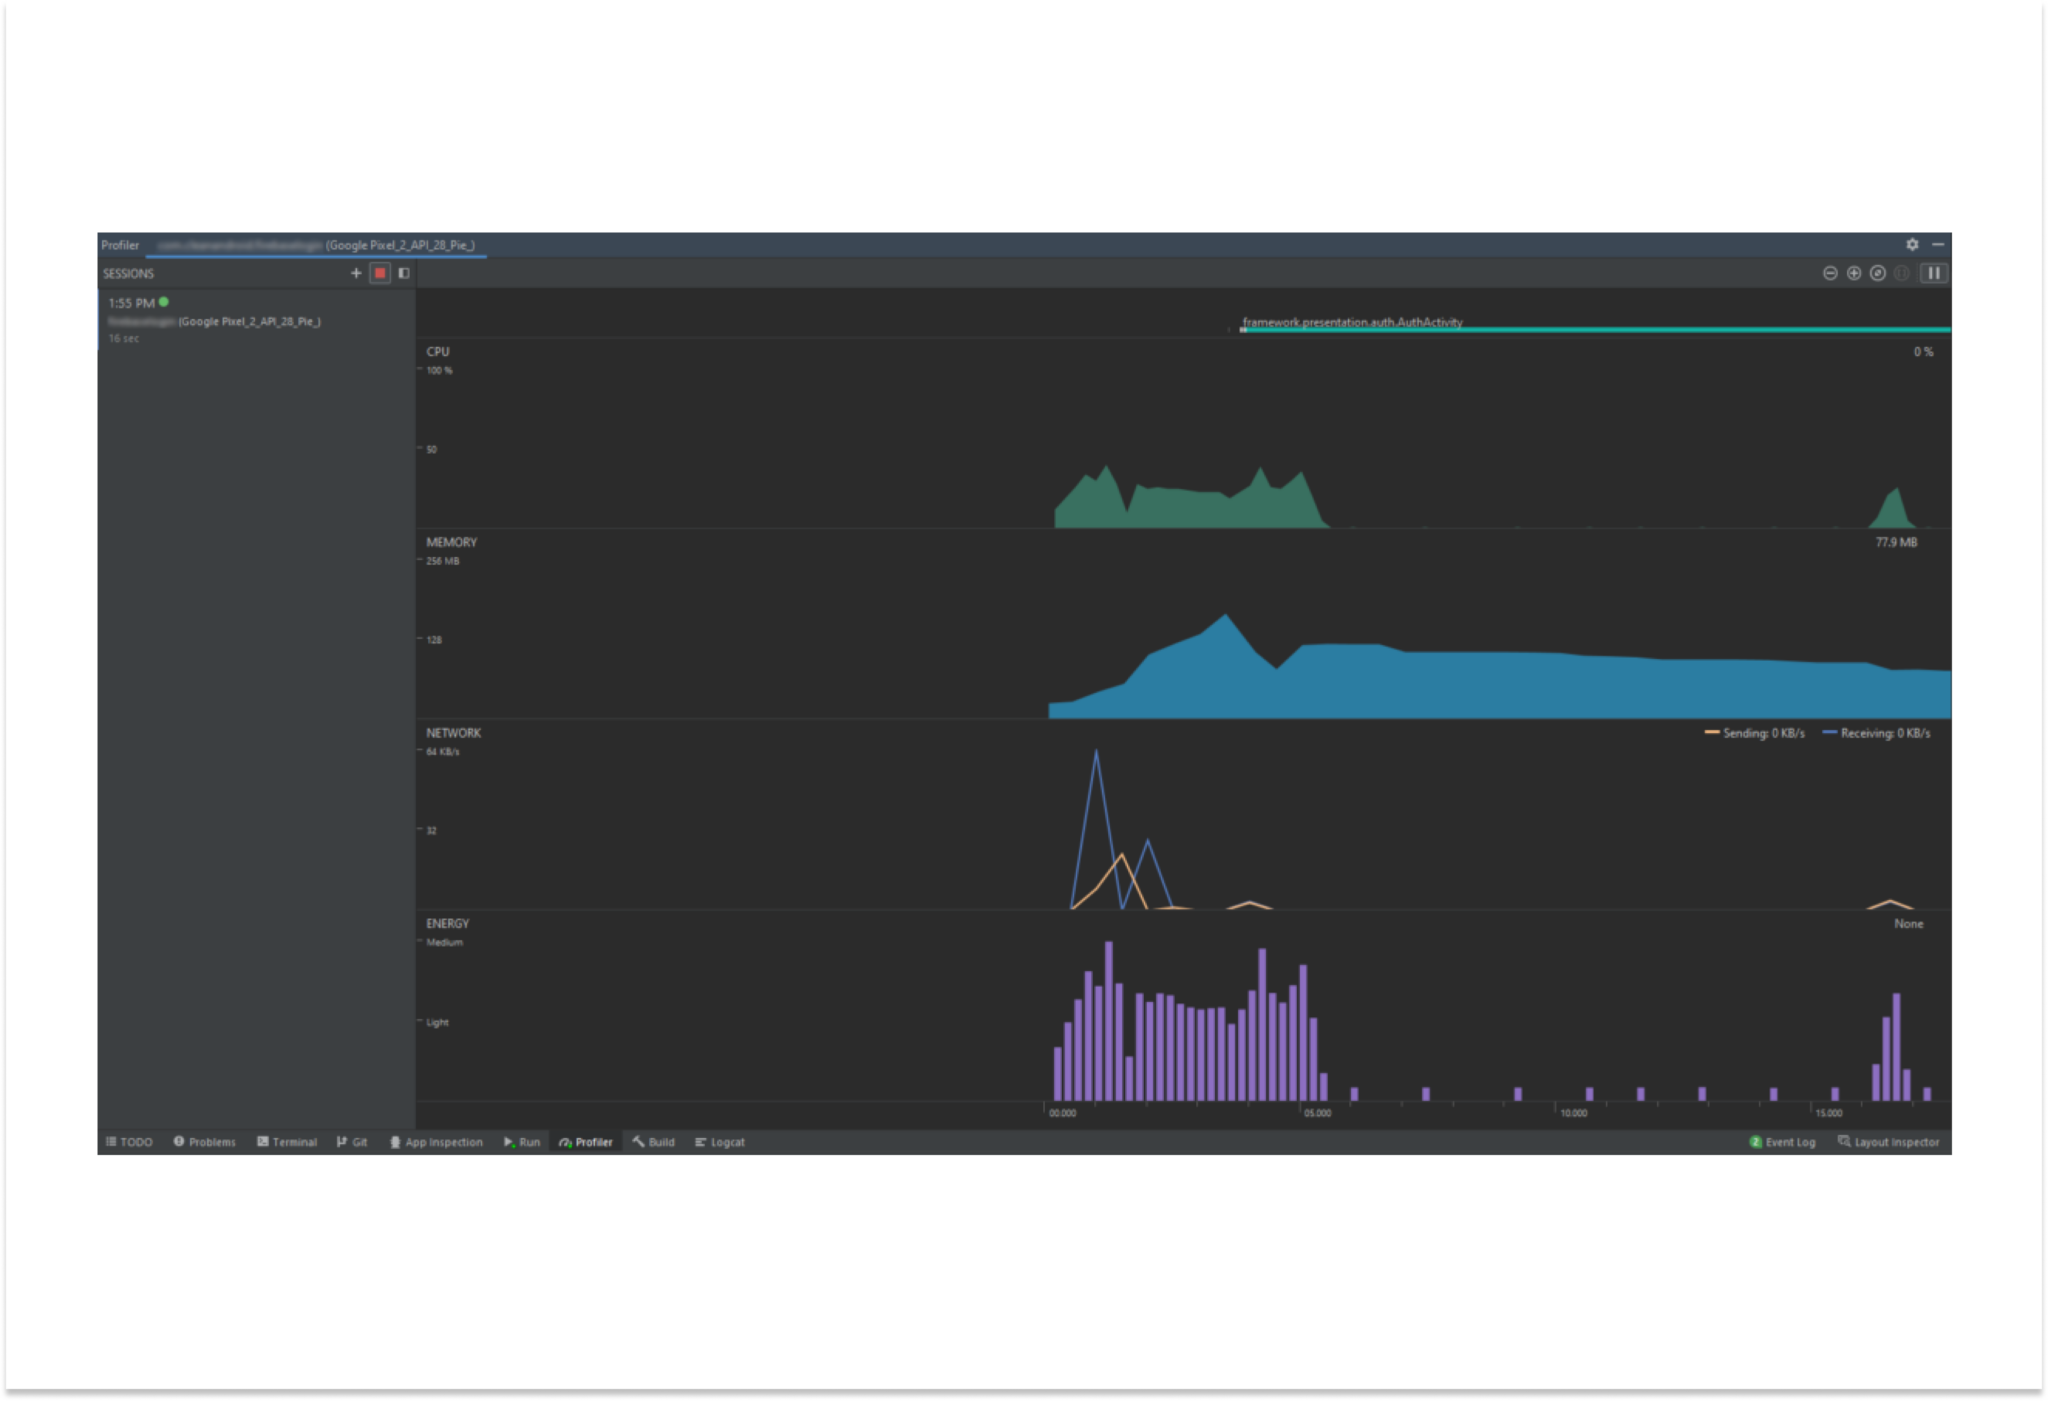
You can see how the application has used memory in greater detail in the new window that appears. Once the application has opened MainActivity, for instance, you can see how the memory was used.
We still don’t know where in our code a memory leak may happen. In order to study garbage collection and identify any problematic memory allocation patterns, we must monitor memory allocation.
Object memory use at any given moment may be examined by recording the heap dump. Before you begin recording, make sure that the Capture heap dump option is selected in your profiler. Getting the outcome will take a little time.
Using LeakCanary for detecting memory leaks
Finding a memory leak with the Android Profiler is something we have already covered. Although it is a fantastic tool for developers to have, it can be somewhat time-consuming, particularly when working on a large project.
Thankfully, LeakCanary provides a faster option.
Android developers may use LeakCanary, a memory leak detector, to monitor and mitigate OutOfMemoryError crashes. It keeps an eye on the events that occur during the Android application lifecycle, such as the creation, destruction, and trash collection of activities, fragments, views, and view models.

When an object is destroyed, LeakCanary may keep weak references to it using ObjectWatcher. After that, AppWatcher keeps an eye on the things that aren’t being used anymore. Unchecked instances that have weak references will be maintained and marked as potentially leaking instances if they are not removed within five seconds.
While the app is running and visible, LeakCanary will dump a Java heap into a file named.hprof when the number of objects held by the ObjectWatcher reaches a certain threshold. In order to avoid trash collection, it examines the heap for the chain of references that safeguards the instances that were preserved.
Here’s an example to help you understand this material: To begin, modify your Android Studio project as follows to include the LeakCanary dependency:
dependencies {
//Add the debugImplementation as LeakCanary framework is supposed to only run in debug builds.
debugImplementation ‘com.squareup.leakcanary:leakcanary-Android:2.8.1’
}
LeakCanary will install itself on your device immediately as soon as you launch the program. To have a close look at the leaks, open the LeakCanary.
From the garbage collector root to the objects passing the leaked reference, the details screen displays a track of the memory leak.
Examples of common memory leaks in Android
Memory leaks in various parts of the application may happen in many different ways. Here are a few things to keep in mind and pieces of advice to help you write better code.
Context
With context, an app’s many parts could communicate with each other. Launch activities, databases, and internal storage on an Android device; access resources (layouts, photos, strings, etc.); and build new objects.
This and getApplicationContext are two methods that may be used to access a context.
A context makes reference to an additional component. How you include them in your application is crucial.
As an example, let’s recall the singleton class from before:
public class SingletonClass {
private static SingletonClass singletonClassInstance;
private Context context;
private SingletonClass(Context context){
this.context = context;
}
public static void singletonClassInstance(Context context){
if (singletonClassInstance == null){
singletonClassInstance = new SingletonClass(context);
}
}
}
The method SingletonClass.singletonClassInstance(this) is being used to access the SingletonClass class inside the MainActivity. To get the SingletonClass data, we are using the parameter this to get its context.
Here, we’re dealing with a Java class called context. It offers a means to learn about the inner workings of the app or other OS features.
Nevertheless, you’ll find that the activity will be leaked when the SingletonClass is executed in MainActivity, utilizing this context.
The whole application’s life span is connected to context. Since this is the case, memory leaks might result from improper context usage. Always double-check your use of context.
If your object persists after your activity has ended, you may get its context using the getApplicationContext method. But you can’t use it to refer to any UI elements. Make sure you’re utilizing the ApplicationContext whenever you have a singleton.
In cases where the object’s lifespan does not extend beyond the activity, this may also be used. You may use it to refer to UI elements. The activity lifespan is the limit for UI components since they are not long-running actions. Operations like XML layouts, interaction, resource retrieval, and activity initiation may all take advantage of this environment.
A memory leak has occurred in our scenario due to the lack of appropriate context. Since there is only room for one context-implementing object in our SingletonClass, getApplicationContext is the way to go.
getApplicationContext returns a distinct context. You will always obtain the same instance when accessing the context. Therefore, its use does not generate fresh circumstances.
You may fix the memory leak by running SingletonClass:
SingletonClass.singletonClassInstance(getApplicationContext());
Static references
The application could have memory leaks if static members are used excessively. A static member may remain online for a longer period of time and is effectively always accessible by the application. The static members of a class are allocated to memory when your application loads it into the Java virtual machine (JVM). Their longer lifespan means they’ll stay in memory until that class is no longer eligible for trash pickup.
In order to observe its behavior with regard to the memory leak, let’s construct a static view.
Set up this TextView with an initial value taken from your XML file:
private static TextView textView;
Create a class to update the TextView values:
private void changeText() {
textView = (TextView) findViewById(R.id.testview);
textView.setText(“Update Hello World greetings!”);
}
Now, execute the class inside the onCreate() method:
changeText();
Keep in mind that the changeText() class execution includes this static view. As a result, it will serve as a permanent record of that action. After the activity’s lifetime ends, the static view continues to operate in the background. As long as the view retains a connection to the activity, it will not be considered garbage collected. Because of this, a memory leak will occur throughout this process.
All objects of a particular class may share the same variable by using the static keyword. To prevent memory leaks, we may remove the reference to the view within an onDestroy() if it must be retained statically. Because of this, the activity might be destroyed along with its static reference when it is deleted.
@Override
protected void onDestroy() {
super.onDestroy();
textView = null;
}
The easiest method to prevent this from occurring, as shown in this example, is to initialize the view without the static keyword at all times. You shouldn’t be held statically if it’s not necessary:
private TextView textView;
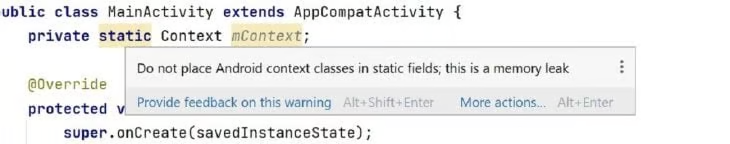
A further instance of a static reference to the activity context that could lead to activity leaks is seen below:
private static Context mContext;
Execute it inside the onCreate() method:
mContext = this;
This static field is related to a potential leak, and even Android Studio will alert you about it.
Not holding it statically is the best way to address this. To secure it in a static field, use a weak or virtual reference:
private static WeakReference<Context> mContext;
Execute it inside the onCreate() method:
mContext = new WeakReference<> (this);
In the onDestroy() function, you may easily repair it by changing it to null.
Threaded code
Your apps are very vulnerable to memory leaks caused by threaded programming. In order to do several tasks in a series, threads break down the execution logic.
Android allows for the execution of numerous processes simultaneously via the use of threads. Since threads lack their own dedicated execution context, they must take their cues from the parent task in order to function. Thus, within the confines of a single process, threads may easily interact and share data.
Take a quick look at how a simple thread might be the cause of an Android memory leak.
Get a thread task started first:
private final ThreadedTask thread = new ThreadedTask();
Next, set up a threaded task:
private class ThreadedTask extends Thread {
@Override
public void run() {
// Run the ThreadedTask for some time
SystemClock.sleep(1000 * 20);
}
}
Then, in the onCreate(), run the code:
thread.start();
It will take some time for the ThreadedTask to complete its execution when it is started. You won’t be able to garbage-correct an activity that is executing ThreadedTask if you exit it before it finishes running. When anything is running in the background and references a view, activity, or context, it might lead to a memory leak if not handled appropriately.
Using a static class will address this leak. No reference to the containing activity class is present in the static class. The onDestroy method also allows you to halt this thread once the activity is destroyed:
// make ThreadedTask static to remove reference to the containing activity
private static class ThreadedTask extends Thread {
@Override
public void run() {
// check if the thread is interrupted
while (!isInterrupted()) {
// Run the ThreadedTask for some time
SystemClock.sleep(1000 * 20);
}
}
}
The thread will be terminated and the isInterrupted() method will return true if the activity is destroyed.
@Override
protected void onDestroy() {
super.onDestroy();
//kill the thread in activity onDestroy
thread.interrupt();
}
Handler threads
Handler is a background thread used in Java. Until the application terminates thread execution, it continues to operate in the background and perform tasks progressively.
The primary function of a handler is to update various components according to the execution thread and interact with the application’s user interface. The progress bar is a great illustration of how to use a handler application. You may schedule messages and alter the user interface depending on various repeated tasks using the handler, which uses loopers to construct message queues.
The way you build handlers might affect their ability to prevent memory leaks, since they are threads that run numerous times.
This is an Android basic handler.
First, initialize a handler task.
private final Handler handler = new Handler(Looper.getMainLooper());
Then, execute the task inside the onCreate() method:
handler.postDelayed(new Runnable() {
@Override
public void run() {
textView.setText(“Handler execution done”);
}
// delay its execution.
}, 1000 * 10);
Upon execution, this handler adds a callback to the activity. Because of this, memory leaks caused by garbage collection won’t happen during the activity.
Make sure to delete all callbacks in order to resolve the issue. Within the confines of a single process, threads interact and share data. That is why, when calling the onDestroy() function, all associated callbacks must be deactivated.
Resolving the memory leak and removing the handler references:
@Override
protected void onDestroy() {
super.onDestroy();
//remove the handler references and callbacks.
handler.removeCallbacksAndMessages(null);
}
In your applications, threads may leak in several ways. Full execution of the thread lifecycle from creation to termination is an indicator of well-written threaded execution. Also, watch out for any indirect calls to the outer (parent)class from the inner class.
There are a lot of potential places for leaks to happen. Leaks may also occur in other situations, such as:
- Listeners
- Observable
- Disposables
- Bitmap objects
- Inner classes: non-static inner classes and anonymous inner classes
- AsyncTask
- Location managers
- Resource objects, such as a cursor or file
- Fragments
- Lazy binding
- ListView binding
Wrapping up
Even for skilled Android developers memory leaks are easy to miss. The aforementioned are a few typical situations in which leaks might happen. But, depending on your coding, leaks might happen anywhere in the application.
To ensure that your application is free of memory leaks before releasing it to the public, it is recommended to run it using one of the techniques mentioned above.